
Jump to section:
Background
Symmetric provides the public reference-point for hedge fund investment skill. Some of the most sophisticated hedge fund allocators (hedge fund of funds, family offices, endowments) and financial advisors incorporate the analysis and rankings for due diligence and on-going monitoring of their hedge fund investments.
Many equity managers market themselves on their ability to pick individual stocks and are paid 2 and 20 for this skill, but it is often difficult to look at a hedge fund's overall returns and know how much of that came from stock picking.
Symmetric begins with a historical database of hedge fund holdings across a universe of more than one thousand funds. By observing how these holdings change and perform over time, we can assess the underlying skill of the investor and attribute it to their ability to pick stocks or sectors and size positions.
Symmetric's rankings are unique in the industry because they are based on isolating manager skill as opposed to returns. Overall hedge fund returns are driven by a number of factors including stock picking, sector picking, net long/short exposure, leverage, etc. All these factors drive returns, but managers are typically paid high fees of two-and-twenty for their stock picking skill or StockAlpha.
Symmetric's rankings are the first in the industry to isolate stock picking alpha and publicly rank hedge funds based upon that metric. The platform's analysis provides a framework to force-rank each hedge fund manager. The rankings illustrate the relative skill of equity long-short managers express, the most important of which is picking stocks.
The Quarterly Symmetric Stock Pickers Rankings recognizes those managers that are exceptional stock-pickers overall and by sector and the key investments themes that drive the industry. More importantly, it introduces the transparency with which ordinary investors can see the best possible publicly driven analysis of hedge fund decision-making and performance.
Methodology
Data
Symmetric begins with a historical database of hedge fund holdings across a universe of more than one thousand funds harvested from regulatory filings. Because hedge funds are required to file with the SEC, using regulatory filings to calculate rankings controls more effectively for survivorship bias compared to hedge fund analysis that depends upon self-reporting. By observing how these holdings change and perform over time, we can assess the underlying skill of the hedge fund and attribute it to their ability to pick individual stocks.
Measuring StockAlpha
StockAlpha measures a hedge fund manager's ability to pick stocks that outperform their corresponding sector. The commonly used Brinson-Fachler performance attribution methodology provides the foundation for the Symmetric approach. Intuitively, our approach is equivalent to calculating the performance of a portfolio in which each individual stock position is hedged with a sector index to create a market neutral and beta neutral portfolio. The return of that hedged portfolio corresponds to the manager's stock picking skill and is what we call StockAlpha.
The rough intuition behind how this is calculated is as follows: let us assume that a hedge fund manager held Apple stock for a quarter. If Apple rallied 10% over that quarter at the same time as when the technology sector rallied 7%, much of that 10% return may have been coming from the sector. The manager in this instance picked a great sector, which is worth ~7%, but the manager's ability to pick stocks that outperform its peers is ~3% (10% minus 7%). We define StockAlpha as one's ability to pick a security that outperforms its sector.
To calculate StockAlpha, a managers' long positions are first harvested from 13-F filings on a quarterly basis. The quarter-end sample forms the basis of a return-series that assumes the manager is able to trade in and out of the new and old positions at security prices at the end of each quarter. We calculate the return of the publicly disclosed portfolio and the resulting return series is called the "actual return of the publicly disclosed portfolio."
Next, we map each security in the publicly disclosed portfolio to a sector according to a standard industry mapping. We calculate the beta of each stock to its corresponding sector using daily price data with a one-year look-back. The betas adjust the exposure to each sector index required to hedge the individual stock. Based upon this mapping, we calculate the return of a "proxy portfolio" that captures how much of the "actual portfolios" returns come from the sectors that those stocks happened to be in.
The difference between the actual return of the publicly disclosed portfolio and the proxy portfolio each quarter is the StockAlpha of the manager for the quarter. The sum of the trailing four or twelve quarters, respectively, are the StockAlpha for the year or the past three years.
The Symmetric Twenty - Ranking the Top Skilled Investors
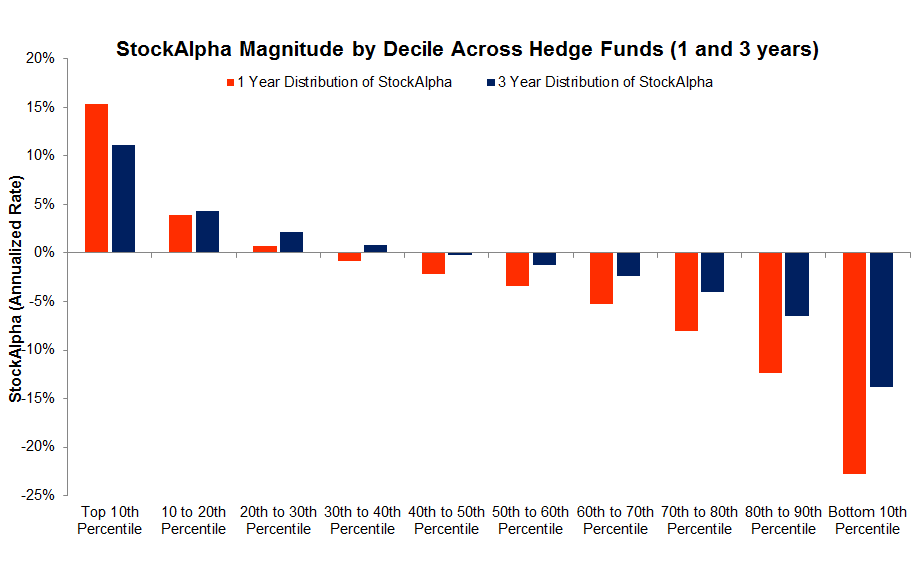
StockAlpha Across the Hedge Fund universe
Stock picking is difficult. The distribution of StockAlpha shows that over the past three years just over half of managers have generated positive stock picking skill. For the trailing twelve months, 30% of managers have demonstrated positive StockAlpha; this means that only 30% of managers were able to pick stocks that outperformed their sectors. This is a meaningful decline in skill from our previous report, in which 50% had delivered positive StockAlpha over the previous twelve months. Nonetheless, the average manager over the last year has demonstrated negative StockAlpha.
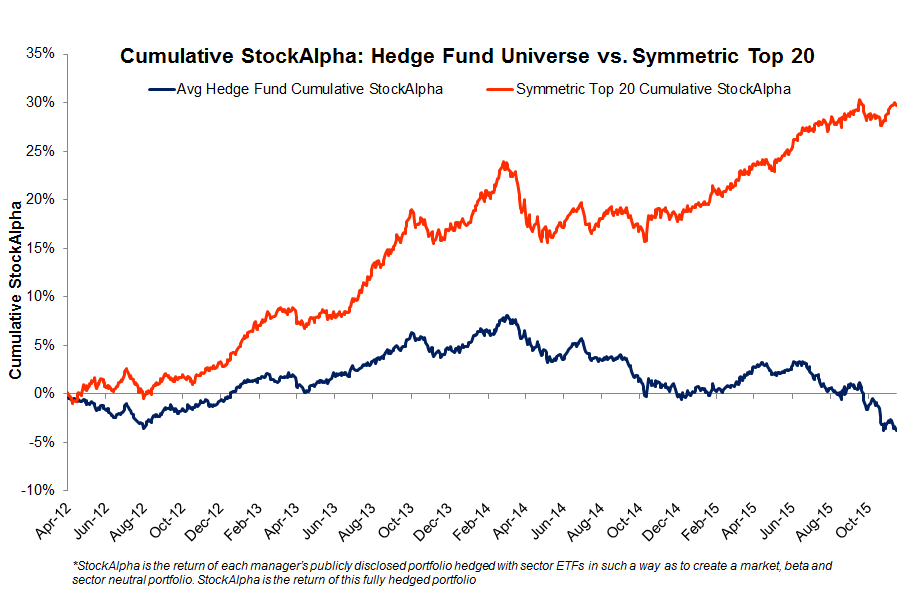
Symmetric Top 20 Cumulative StockAlpha vs. HF universe Cumulative StockAlpha
The Symmetric Twenty comprise the top twenty ranked long-short equity managers. We force-rank the entire Symmetric universe according to their realized StockAlpha year to date, 12 months back and three years back. The list is further adjusted to reflect those whose StockAlpha has not only the greatest magnitude, but also the greatest consistency over each period.
The following chart shows the cumulative StockAlpha for the Symmetric Top 20 vs. cumulative StockAlpha for the entire hedge fund universe. The chart demonstrates the magnitude of dispersion between the best and most consistent stock pickers and the average stock pickers. The Symmetric Top 20 have added over 25% of StockAlpha above the average hedge fund over the past 3 years or roughly 8% a year. With hedge fund fees typically being around 2% of assets and managed and 20% of profits, its clear that only the very top stock pickers are worth paying for. The average hedge fund would return negative StockAlpha after fees.
Overall StockAlpha - 4th Quarter 2015 Symmetric Twenty
| Name | Founder | 3 Yr StockAlpha Magnitude | 3 Yr StockAlpha Sharpe |
|---|---|---|---|
| Baker Bros Advisors Llc | Julian Baker | 24.68% | .83 |
| Altimeter Capital Management Ll | Bradley Gerstner | 18.61% | 1.44 |
| Whale Rock Capital Management | Alexander Sacerdote | 15.55% | 1.1 |
| Ancient Art Lp | Quincy Lee | 11.66% | 1.16 |
| Matrix Capital Management | David Goel | 11.42% | 1.24 |
| Stieven Capital Advisors Lp | Joseph Stieven | 9.28% | 1.52 |
| Bridger Management Llc | Roberto Mignone | 9.23% | 1.03 |
| V3 Capital Management Lp | Charles Fitzgerald | 9.13% | .86 |
| Dorsal Capital Mgmt Llc | Ryan Frick | 9.06% | .94 |
| Newbrook Capital Advisors Lp | Robert Boucai | 7.29% | 1.11 |
| Castine Capital Management | Ostrom Enders | 6.29% | 1.05 |
| Trian Fund Management Lp | Nelson Peltz | 6.24% | .87 |
| Criterion Capital Management | Christopher Lord | 5.41% | .67 |
| Ems Capital Lp | Edmond Safra | 5.38% | .67 |
| Echo Street Capital Mgmt Llc | Gregory Poole | 4.29% | .98 |
| Basswood Capital Management Llc | Matthew Lindenbaum | 4.26% | .71 |
| Spo Advisory Corp | John Scully | 4.26% | .85 |
| Tremblant Capital Group | Brett Barakett | 3.77% | .63 |
| Jacobs Asset Management Llc | Seymour Jacobs | 3.73% | .64 |
| Msf Capital Llc | Mark Fife | 2.89% | .6 |
Key Highlights - 4th Qtr 2015 vs. 3rd Qtr 2015
A handful of managers have been on the list for at least three quarters:
| Name | Founder | 3 Yr StockAlpha Magnitude | 3 Yr StockAlpha Sharpe |
|---|---|---|---|
| Matrix Capital Management | David Goel | 11.42% | 1.24 |
| Tremblant Capital Group | Brett Barakett | 3.77% | .63 |
| Dorsal Capital Mgmt Llc | Ryan Frick | 9.06% | .94 |
| Echo Street Capital Mgmt Llc | Gregory Poole | 4.29% | .98 |
Symmetric Rankings - Key Positions
StockAlpha Across the Hedge Fund universe
Each stock picker owes their success to their underlying positions. We looked at the key positions that have driven their stock-picking success since September 30th, 2015. These are organized according to the top 5 positions that contributed the most in aggregate to the StockAlpha of the top twenty stock-pickers from September 30th, 2015 to present. These are the winners that helped pushed the Symmetric Twenty forward most recently.
Symmetric Twenty's Top Five Most Profitable Bets 4th Qtr 2015
| Rank | Ticker | Name of Stock | Fund(s) | Average Position Size | 4Q15 Return of Stock vs. Sector |
|---|---|---|---|---|---|
| 1 | AMZN | Amazon.com Inc. | Altimeter, Criterion, Newbrook, Tremblant, Whale | 5% | 21% |
| 2 | HSIC | Schein (Henry) Inc. | Echo, Msf | 22% | 9% |
| 3 | CTRP | Ctrip.Com International Ltd ADS | Altimeter, Tremblant | 4% | 49% |
| 4 | GOOG | Google Inc. Class C | Ancient, Ems, Msf, Whale | 8% | 11% |
| 5 | LNKD | Linkedin Corporation | Criterion, Dorsal, Ems, Matrix | 4% | 21% |
| 6 | DD | E. I. du Pont de Nemours & Co. | Trian | 11% | 29% |
| 7 | GE | General Electric Co | Msf, Trian | 10% | 13% |
| 8 | CBS | CBS Corp. (DE) Class B | Dorsal, Tremblant | 6% | 20% |
| 9 | FB | FBR Asset Investment Corp. | Bridger, Criterion, Dorsal, Ems, Whale | 6% | 8% |
| 10 | DYAX | Dyax Corp | Baker, Bridger | 1% | 75% |
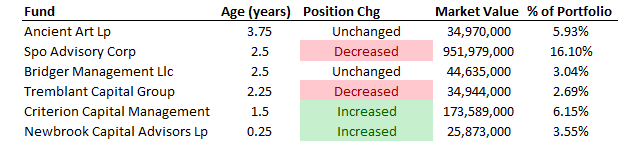
Investors holding a basket of hedge funds can often end up with exposure to just a few key bets. Symmetric's position overlap and portfolio monitoring shows who is relatively early to an idea vs. those who came later. Of particular note on the list was Valeant Pharmaceuticals (VRX) in our Q3 report. It was owned by seven of the Symmetric Top 20 and had driven a sizable portfolio of the alpha generated by the Symmetric Top 20, at the time. Today's report illustrates similar concentration with Charter Communications (CHTR), with six of the Symmetric Top 20 holding CHTR. The table below shows the popularity of CHTR amongst the Symmetric Top 20 and when each hedge fund entered the trade.
Symmetric Rankings - Recent Activity
What have the Skilled Investors been doing?
Skilled investors separate themselves from the hedge fund universe through their stock-picks. Unlike the picks of the universe overall, these picks are those that drive the top performers. We highlighted the positions skilled investors initiated, accumulated and exited recently.
Symmetric Twenty's The Top Five Recent New Positions
| Rank | Ticker | Name of Stock | Fund(s) | Average Position Size | 4Q15 Return of Stock vs. Sector |
|---|---|---|---|---|---|
| 1 | COMM | CommScope Holding Co | Criterion, Dorsal, Tremblant | 4% | -7% |
| 2 | BA | Boeing Company | Ancient | 10% | 2% |
| 3 | TEVA | Teva Pharmaceutical Industries Ltd ADR | Bridger | 7% | -2% |
| 4 | PNR | Pentair Plc | Trian | 6% | 1% |
| 5 | AYA | Alyst Acquisition Corp. | Ancient | 5% | -17% |
Symmetric Twenty's Top Five Recent Increased Positions
| Rank | Ticker | Name of Stock | Fund(s) | Average Increase in Position Size | 4Q15 Return of Stock vs. Sector |
|---|---|---|---|---|---|
| 1 | NFLX | Netflix Inc | Criterion, Ems, Matrix, Newbrook, Whale | 10% | -4% |
| 2 | UAL | United Continental Holding Co. | Altimeter | 15% | 4% |
| 3 | SYY | Sysco Corp. | Trian | 10% | 1% |
| 4 | GOOG | Google Inc. Class C | Ancient, Ems, Msf, Whale | 10% | 11% |
| 5 | GE | General Electric Co | Msf, Trian | 9% | 13% |
Update on Activists
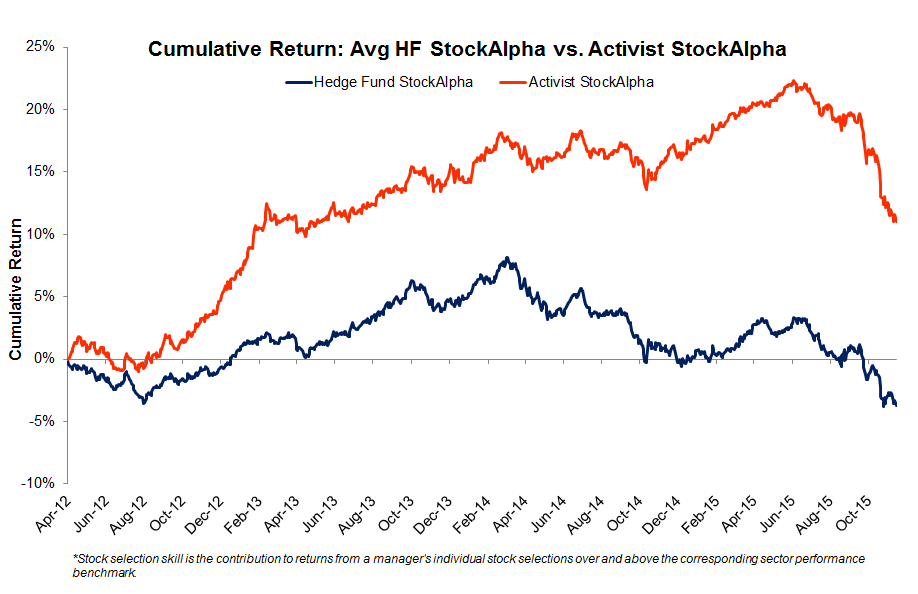
Activist Investors add negative value over past few months
Activist investors were generally hurt by the performance of Valeant Pharmaceuticals (VRX). delivered negative StockAlpha over the past few months beyond that of the average equity L/S HF. Activists are not industry-specialists, but their stock-picks have outperformed the corresponding sectors over the last few years despite the recent poor alpha generation. The chart below provides cumulative StockAlpha of a basket of 15 activist funds vs. the cumulative StockAlpha of the average hedge fund. The reason for the recent underperformance was varied:
Pershing Square and Brave Warrior: Hurt by large exposures to VRX
Engaged Capital: Hurt in October by a 19.7% decline in MagnaChip (MX) (9% position)
Corvex: Hurt by 10.7% decline in YUM in October (20% position)
Starboard Value: Hurt by 9% decline in DRI (27% position) in October
Activist Investors - Overlap
Many expect Activist Investors to overlap with one another. While this does happen, it is not as wide-spread as one might expect. When the Symmetric Activist Monitor does show overlap it's notable for two reasons. First, the timing of when they were initiated. One can see the manager that led the entrance into the position and distinguish them from the managers who come later. Second, the scale of the positions. Many of the overlapping positions share a common scale. The activist managers who enter alongside their peers do so according to a meaningful percentage of their publicly disclosed portfolio. When they follow, it is generally with high conviction.
Allergan (AGN): Overlapped by six Activist Managers, with an average age of one year
Time Warner Cable (TWC): Overlapped by five Activist Managers, with an average age of one quarter
Valeant Pharmaceuticals (VRX): Overlapped by three Activist Managers, with an average age of 4.7 years
Bank of New York (BK): Overlapped by three Activist Managers, with an average age of .8 years
Hedge Fund Ownership of Recent IPOs
How have Hedge Fund Managers Taken to IPOs?
Hedge Fund managers have also participated in many recent IPOs. Our
holdings analysis evaluated the aggregate flow of funds for the position from the first quarter through the end
of the second quarter. We looked at select IPOs in the past quarter and also
reviewed the flow of funds of recent high-profile IPOs.
Our follow-up analysis of recent high profile IPOs, such as Ali Baba,
Lending Club, Shake Shack, OnDeck, and BOX showed mixed results. Ali
Baba continued to lose hedge fund ownership, declining 16.6% on a
flow-of-funds basis and losing ten hedge fund owners, from 113 to
103.
Our evaluation of select Q2 IPOs focused on Fitbit, Etsy, GoDaddy,
and Shopify. The most popular IPO among these had been FIT, which had twice
the number of hedge fund holders as SHAK, but has since declined in hedge fund ownership to 25. ETSY is
the least popular hedge fund holding, among the sample. GoDaddy, Yodlee, Hubspot and ShakeShack each gained hedge fund holders during the period.
A full table of holdings, flow of funds and ownership data is below.
| Ticker | Value of Current Ownership ($) | Chg in Shares Owned by HFs (June-30 to Sep-30) | # HF Owners (June-30) | # HF Owners (Sep-30) |
| BABA | 4,981 MM | -1.6% | 107 | 78 |
| LC | 641 MM | +33.6% | 33 | 20 |
| ONDK | 183 MM | -4.8% | 14 | 8 |
| SHAK | 32 MM | +10.8% | 17 | 19 |
| BOX | 67 MM | +103.7% | 13 | 11 |
| HUBS | 66 MM | +51% | 15 | 18 |
| YDLE | 64 MM | +144% | 13 | 15 |
| ETSY | 168 MM | -8.8% | 10 | 4 |
| FIT | 200 MM | -19.9% | 32 | 25 |
| SHOP | 51 MM | -4.6% | 18 | 13 |
| GDDY | 1,091 MM | +1.4% | 26 | 28 |