Background
Symmetric provides the public reference-point for hedge fund investment skill. Some of the most sophisticated hedge fund allocators (hedge fund of funds, family offices, endowments) and financial advisors incorporate the analysis and rankings for due diligence and on-going monitoring of their hedge fund investments.
Many equity managers market themselves on their ability to pick individual stocks and are paid 2 and 20 for this skill, but it is often difficult to look at a hedge fund's overall returns and know how much of that came from stock picking.
Symmetric begins with a historical database of hedge fund holdings across a universe of more than one thousand funds. By observing how these holdings change and perform over time, we can assess the underlying skill of the investor and attribute it to their ability to pick stocks or sectors and size positions.
Symmetric's rankings are unique in the industry because they are based on isolating manager skill as opposed to returns. Overall hedge fund returns are driven by a number of factors including stock picking, sector picking, net long/short exposure, leverage, etc. All these factors drive returns, but managers are typically paid high fees of two-and-twenty for their stock picking skill or StockAlpha.
Symmetric's rankings are the first in the industry to isolate stock picking alpha and publicly rank hedge funds based upon that metric. The platform's analysis provides a framework to force-rank each hedge fund manager. The rankings illustrate the relative skill of equity long-short managers express, the most important of which is picking stocks.
The Quarterly Symmetric Stock Pickers Rankings recognizes those managers that are exceptional stock-pickers overall and by sector and the key investments themes that drive the industry. More importantly, it introduces the transparency with which ordinary investors can see the best possible publicly driven analysis of hedge fund decision-making and performance.
Methodology
Data
Symmetric begins with a historical database of hedge fund holdings across a universe of more than one thousand funds harvested from regulatory filings. Because hedge funds are required to file with the SEC, using regulatory filings to calculate rankings controls more effectively for survivorship bias compared to hedge fund analysis that depends upon self-reporting. By observing how these holdings change and perform over time, we can assess the underlying skill of the hedge fund and attribute it to their ability to pick individual stocks.
Measuring StockAlpha
StockAlpha measures a hedge fund manager's ability to pick stocks that outperform their corresponding sector. The commonly used Brinson-Fachler performance attribution methodology provides the foundation for the Symmetric approach. Intuitively, our approach is equivalent to calculating the performance of a portfolio in which each individual stock position is hedged with a sector index to create a market neutral and beta neutral portfolio. The return of that hedged portfolio corresponds to the manager's stock picking skill and is what we call StockAlpha.
The rough intuition behind how this is calculated is as follows: let us assume that a hedge fund manager held Apple stock for a quarter. If Apple rallied 10% over that quarter at the same time as when the technology sector rallied 7%, much of that 10% return may have been coming from the sector. The manager in this instance picked a great sector, which is worth ~7%, but the manager's ability to pick stocks that outperform its peers is ~3% (10% minus 7%). We define StockAlpha as one's ability to pick a security that outperforms its sector.
To calculate StockAlpha, a managers' long positions are first harvested from 13-F filings on a quarterly basis. The quarter-end sample forms the basis of a return-series that assumes the manager is able to trade in and out of the new and old positions at security prices at the end of each quarter. We calculate the return of the publicly disclosed portfolio and the resulting return series is called the "actual return of the publicly disclosed portfolio."
Next, we map each security in the publicly disclosed portfolio to a sector according to a standard industry mapping. We calculate the beta of each stock to its corresponding sector using daily price data with a one-year look-back. The betas adjust the exposure to each sector index required to hedge the individual stock. Based upon this mapping, we calculate the return of a "proxy portfolio" that captures how much of the "actual portfolios" returns come from the sectors that those stocks happened to be in.
The difference between the actual return of the publicly disclosed portfolio and the proxy portfolio each quarter is the StockAlpha of the manager for the quarter. The sum of the trailing four or twelve quarters, respectively, are the StockAlpha for the year or the past three years.
The Symmetric Top Managers - Ranking the Top Skilled Investors
StockAlpha Across the Hedge Fund universe
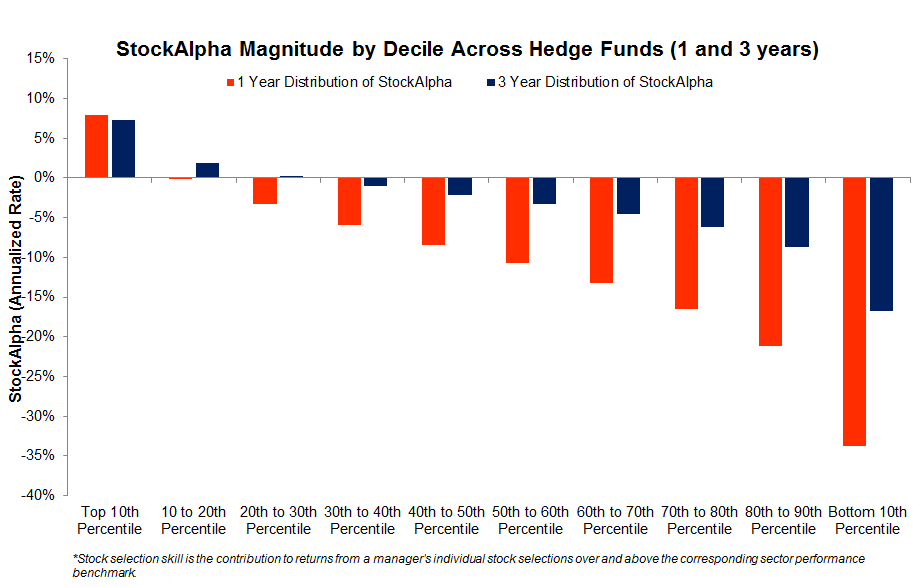
Stock picking is difficult. The distribution of StockAlpha shows that over the past three years just over half of managers have generated positive stock picking skill. StockAlpha has meaningfully declined over the past quarter, though. For the trailing twelve months, just 10% of managers have demonstrated positive StockAlpha; this means that only 10% of managers were able to pick stocks that outperformed their sectors. This presents a continued decline in skill from our previous reports. Our 3Q - 2015 report indicated 50% of managers had produced positive StockAlpha over the trailing twelve months. This was followed by a decline in 4Q - 2015 to 30% of managers who delivered positive StockAlpha over the previous twelve months. And now, the stock-picks of 90% of hedge fund managers have delivered negative StockAlpha and underperformed on a market, beta, and sector adjusted basis.
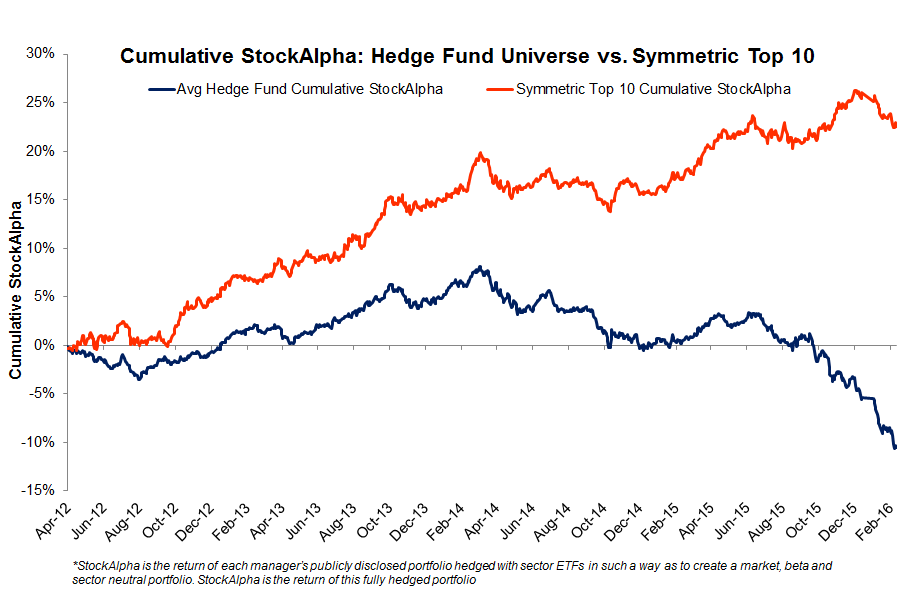
Symmetric Top Managers Cumulative StockAlpha vs. HF universe Cumulative StockAlpha
The Symmetric Managers comprise the top ranked long-short equity managers. We force-rank the entire Symmetric universe according to their realized StockAlpha year to date, 12 months back and three years back. The list is further adjusted to reflect those whose StockAlpha has not only the greatest magnitude, but also the greatest consistency over each period.
The following chart shows the cumulative StockAlpha for the Symmetric Top Managers vs. cumulative StockAlpha for the entire hedge fund universe. The chart demonstrates the magnitude of dispersion between the best and most consistent stock pickers and the average stock pickers. The Symmetric Top Managers have added over 20% of StockAlpha above the average hedge fund over the past 3 years or roughly 7% a year. With hedge fund fees typically being around 2% of assets and managed and 20% of profits, its clear that only the very top stock pickers are worth paying for. The average hedge fund would return negative StockAlpha after fees.
Overall StockAlpha - 1st Quarter 2016 Symmetric Ten
| Name | Founder | 3 Yr StockAlpha Magnitude | 3 Yr StockAlpha Sharpe |
|---|---|---|---|
| Cedar Rock Capital Ltd | Andrew Brown | 6.33% | 1.44 |
| Echo Street Capital Mgmt Llc | Gregory Poole | 3.93% | .96 |
| Highfields Capital Management | Jonathon Jacobson | 3.38% | .8 |
| Third Point Llc | Daniel Loeb | 5.12% | .71 |
| Ems Capital Lp | Edmond Safra | 5.03% | .61 |
| Masters Capital Management Llc | Michael Masters | 7.59% | .58 |
| Endicott Management Company | Wayne Goldstein | 4.9% | .56 |
| Trian Fund Management Lp | Nelson Peltz | 3.41% | .46 |
| Hillhouse Capital Management Lt | Cuifang Ma | 8.79% | .28 |
| H Partners Management Llc | Rehan Jaffer | 2.03% | .13 |
Key Highlights - 1st Qtr 2016 vs. 4th Qtr 2015
Funds that stayed on the list:
Trian Fund Management Helped by MDLZ and GOOG
EMS Capital: Helped by substantial positions in NFLX and FB
Echo Street: Helped by a position EQIX
Many strong managers left the list. We required that managers have a positive start to the year on a StockAlpha basis, and many strong managers, including Baker Brothers, Viking Global, Whale Rock, SPO Advisory, among others were unable to stanch the losses that stemmed from the weak start to the market in 2016. Moreover, not only did their positions decline, they underperformed on a market, sector and beta adjusted basis, so the poor start to the year undermined their positive twelve and thirty-six month track records of top StockAlpha.
The specific circumstances of each manager are different, but it may be that the effects of hedge fund crowding in certain positions have taken their toll. As earlier reports have shown, crowded hedge fund positions tend to underperform dramatically in volatile markets such as we see today. The performance of the Symmetric Hedge Fund Concentration index provides a lens through which to see these effects. Its components, performance, and correlations can be analyzed through the premium service at Symmetric.io.
Symmetric Rankings - Key Positions
StockAlpha Across the Hedge Fund universe
Each stock picker owes their success to their underlying positions. We looked at the key positions that have driven their stock-picking success. These are organized according to the top 5 positions that contributed the most in aggregate to the StockAlpha of the top stock-pickers from December 31st, 2015 to present. These are the winners that helped pushed the Symmetric Ten forward most recently.
Symmetric Top Managers' Top Five Most Profitable Bets - 1st Quarter 2016
| Rank | Ticker | Name of Stock | Fund(s) | Average Position Size | 1Q16 Return of Stock vs. Sector |
|---|---|---|---|---|---|
| 1 | TRXC | Transenterix Inc | Masters | 2% | 65% |
| 2 | ELLI | Ellie Mae Inc. | Ems | 3% | 31% |
| 3 | SYY | Sysco Corp. | Trian | 15% | 7% |
| 4 | MCD | McDonalds Corp. | Highfields | 13% | 11% |
| 5 | BAX | Baxter International Inc. | Third | 21% | 7% |
| 6 | FB | Facebook Inc | Ems | 11% | 6% |
| 7 | BMA | Banco Macro S.A. Class B | Ems | 3% | 24% |
| 8 | BANC | Banc of California | Endicott | 6% | 16% |
| 9 | PG | Procter & Gamble Company | Echo, Cedar | 9% | 4% |
| 10 | JCP | Penney (J.C.) | Masters | 4% | 16% |
Symmetric Rankings - Recent Activity
What have the Skilled Investors been doing?
Skilled investors separate themselves from the hedge fund universe through their stock-picks. Unlike the picks of the universe overall, these picks are those that drive the top performers. We highlighted the positions skilled investors initiated, accumulated and exited recently.
Symmetric Top Managers - Top Five Recent New Positions
| Rank | Ticker | Name of Stock | Fund(s) | Average Position Size | 1Q16 Return of Stock vs. Sector |
|---|---|---|---|---|---|
| 1 | PACW | PacWest Bancorp (DE) | Endicott | 11% | -13% |
| 2 | EQBK | Equity Bancshare | Endicott | 4% | -3% |
| 3 | UPS | United Parcel Service Inc. Class B | Masters | 4% | 7% |
| 4 | UAL | United Continental Holding Co. | Masters | 2% | -9% |
| 5 | ALB | Albemarle Corp. | Masters | 2% | % |
Symmetric Ten's Top Five Recent Increased Positions
| Rank | Ticker | Name of Stock | Fund(s) | Average Increase in Position Size | 1Q16 Return of Stock vs. Sector |
|---|---|---|---|---|---|
| 1 | AGN | Allergan Inc. | Highfields, Third | 5% | -3% |
| 2 | BAC | Bank of America Corp. | Masters | 3% | -15% |
| 3 | CTRP | Ctrip.Com International Ltd ADS | Hillhouse | 3% | -9% |
| 4 | NKE | NIKE Inc. | Ems | 3% | 1% |
| 5 | MET | MetLife Inc. | Masters | 3% | -8% |
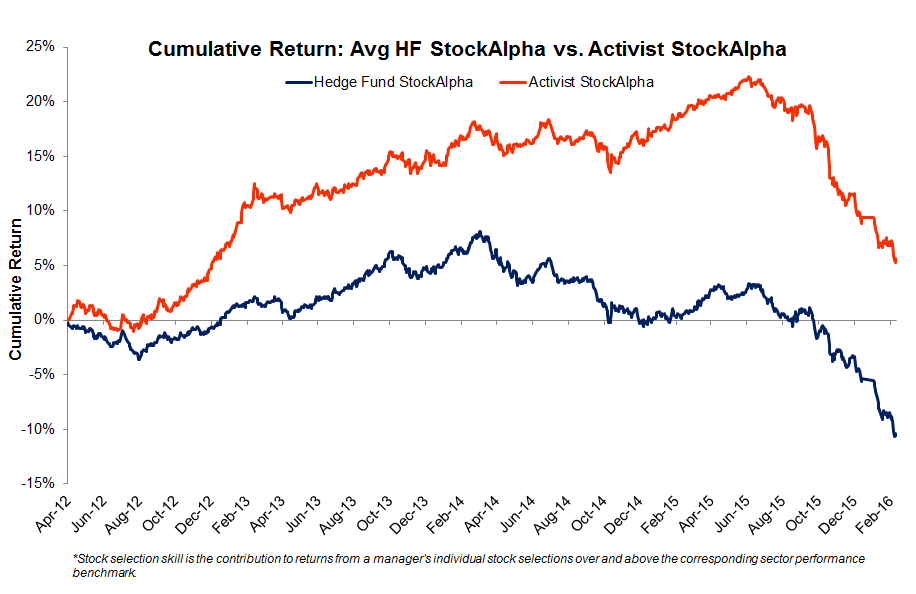
Update on Activists
Activist Investors add negative value over past few months
Activist investors delivered negative StockAlpha over the past few months in line with the average equity L/S HF. Activists are not industry-specialists, but their stock-picks have outperformed the corresponding sectors over the last few years despite the recent poor alpha generation. The chart below cumulative StockAlpha of a basket of 15 activist funds vs. the cumulative StockAlpha of the average hedge fund. The reason for the recent underperformance was varied:
Marcato: Hurt so far in the first quarter by a more than 50% decline in LPLA (13.1% position) and 34% decline in URI (7.5% position)
Icahn: Hurt in the first quarter by 17% decline in IEP (25% position) and 32% decline in CVI this month
Sachem Head Hurt by 26% decline in ADSK in the first quarter (25% position)